Question 1:
Was the
star data for Question 1 compiled using input from all survey
participants (including those from Tilbury and South Chatham
participants who would not be affected by the scenario 1)? If
so, is there a way to remove the Tilbury/Chatham responses from the
analysis to attain a better representation of support from only the
communities affected?
If the Tilbury and South Chatham
area responses are included in the results of Question 1, there is
concern with the prominent listing of "Support for Scenario 1" as one of
the top five Scenario 1 Themes. The highlighted comment for this theme
[i.e. Scenario 1 works best for students and community. This first
scenario seems like the best option for students and community. With
this plan, there would be little disruption in the displacement of
students. A school becomes a community link. This option would have the
least amount of disruption for the least amount of people] was the
most-starred thought. However, there is a significant reason to doubt
whether it was starred because a K-12 in Blenheim would be the best
solution for Blenheim-Ridgetown area students or because it simply was a
scenario that did not threaten the high schools in Tilbury and South
Chatham? If the star counts for Question 1 include stars from an
unspecified number of Tilbury and South Chatham area participants (who
might support it just because it would leave their schools intact), the
true results are not clear. In this case, it would not be valid to
assume that all of the support for Question 1 actually reflects support
for a Blenheim K-12 as a good solution for Ridgetown and Blenheim area
students.
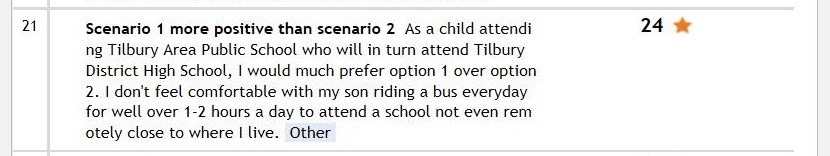
For some of the Question 1 thoughts, the impact of
Tilbury/South Chatham participants is quite apparent. The following two
thoughts (#8, with 27 stars; #21, with 24 stars) appear to provide
"Support for Scenario 1" simply because they preserve TDHS (or JMSS) -
See image below or refer to the Thoughtexchange online report:
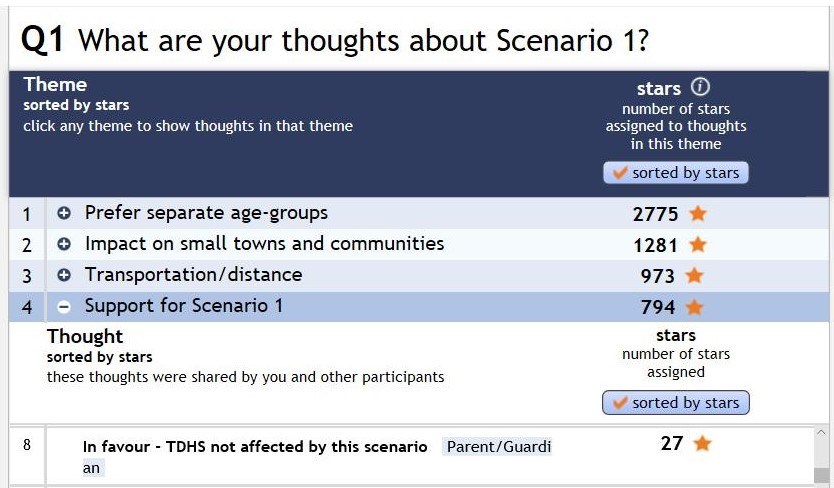
With over 20 stars allotted to these
comments, it is reasonable to assume that the same individuals may have
also allotted a similar number of stars to other comments in support of a
Blenheim K-12. This would have inflated the final ranking of the
"Support for Scenario 1" theme. For Question 1, it would be more valid
to report just the thoughts/stars of participants that did not identify
themselves as being associated with TDHS, TAPS, JMSS or South Chatham
elementary schools.
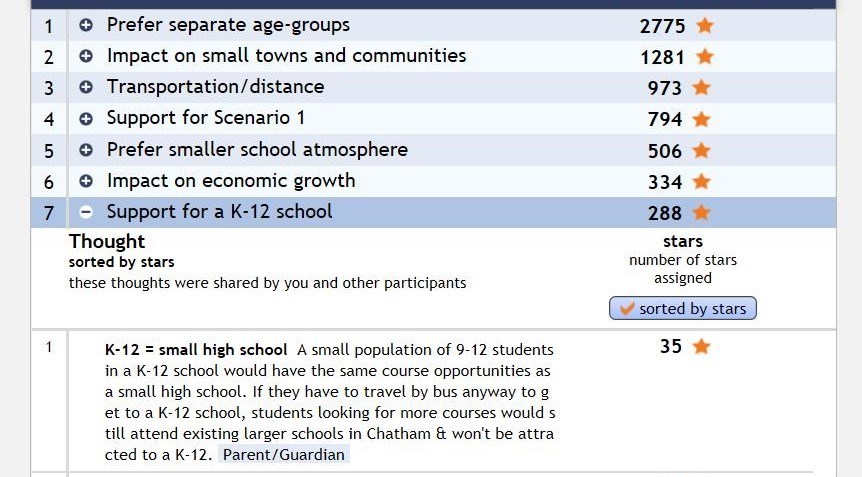
For the related theme (#7), "Support for a
K-12 school", please note that the top-rated comment is wrongly
categorized. Rather than being in support of a K-12, it instead notes
that the secondary panel of a Blenheim K-12 wouldn't be large enough to
offer any significant course/programming advantages (therefore there
would be no gains for Blenheim or Ridgetown area secondary students)
- See image below or refer to the Thoughtexchange online report:
Had the "Support for Scenario 1" and
"Support for a K-12 school" themes been more prominent, perhaps the
Tilbury /S.Chatham input effect would be insignificant. However, themes
#4 and #7 received a total of only 12.8% of the stars for Question 1
compared to 59.8% for the top three themes. The top three themes would
not likely have received much support from Tilbury and South Chatham
area participants (because these themes opposed Scenario 1).
Consider
also that the "Support for Scenario 1" and "Support for a K-12 school"
themes received 794 and 253 (i.e. 288 minus 35, from the incorrectly
categorized thought noted above) stars, respectively. Each
Tilbury/S.Chatham participant had 48 stars available to endorse thoughts
for Question 1 (e.g. 10 participants = 480 stars). The collective
impact may have been quite significant.
Response:
The
Thoughtexchange was intended to allow students, parents, staff and
community members to share their thoughts about the two proposed
scenarios for the Blenheim, Ridgetown, Tilbury, and South Chatham Area
phase of pupil accommodation. The report is one of many tools used to
provide Senior Administration with a better understanding of the issues
that concern students, staff, families and community members in the
Blenheim, Ridgetown, Tilbury, and South Chatham areas and this will
allow the LKDSB to work collaboratively on solutions moving forward.
During
any pupil accommodation review process, the LKDSB welcomes input from
everyone, not only those who live in the boundary area for the schools.
However, it is often the case that these community members are the ones
who express a more significant level of engagement. As an open and
transparent public institution, we feel it is important to consider the
thoughts of all members of our communities, particularly when making
decisions that will have a greater impact on our system as a whole.
To
address the questions, the Thoughtexchange analysis team did a
comparison by geographic area to show the levels of support for
Scenarios 1 and 2. As shown in the graph below, all communities
indicated greater support for Scenario 1 than Scenario 2, with the
exception of Ridgetown. While this geographic area indicated greater
support for Scenario 2, the totals were very similar in terms of overall
percentage (See image below or refer to the Thoughtexchange online report).
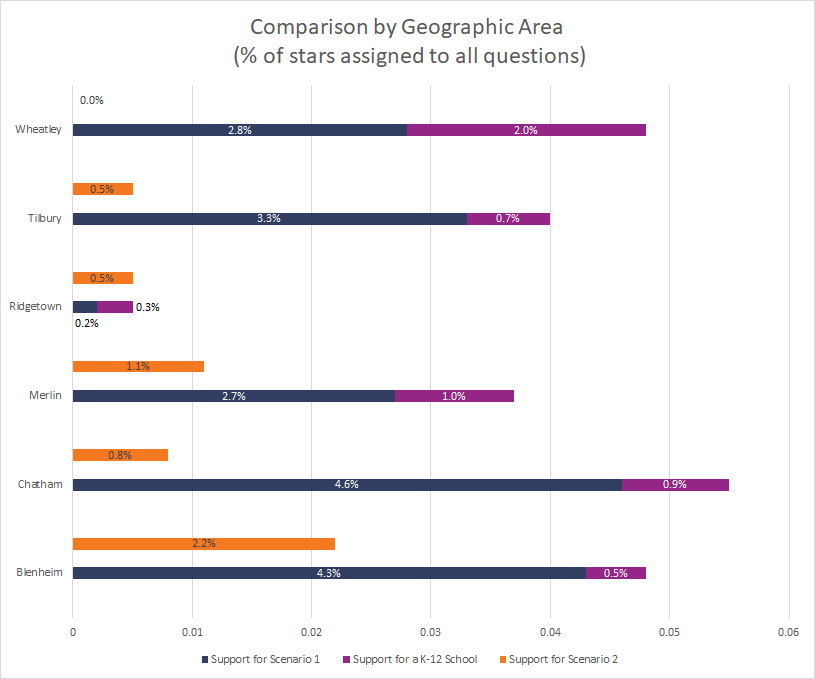
| Geographic Area | Support for Scenario 1 | Support for a K-12 School | Support for Scenario 2 |
| Wheatley | 2.8% | 2% | 0% |
| Tilbury | 3.3% | 0.7% | 0.5% |
| Ridgetown | 0.2% | 0.3% | 0.5% |
| Merlin | 2.7% | 1.0% | 1.1% |
| Chatham | 4.6% | 0.9% | 0.8% |
| Blenheim | 4.3% | 0.5% | 2.2% |
There
was also a question in regard to the impact that removing Tilbury and
South Chatham participants would have on "Support for Scenario 1"
appearing in the top five themes for Q1. The Thoughtexchange team
considered this and the themes could shift slightly if some of the
thoughts were re-themed, but the impact overall was minimal.
Question 2:
At
the May 23 Board meeting, you noted that a breakdown of participation
by community for the Thoughtexchange survey would be available. Is that information public? If so, I would be interested in seeing the numbers. I didn't see many South Chatham-specific comments, so I've wondered whether many from that community participated.
Response:
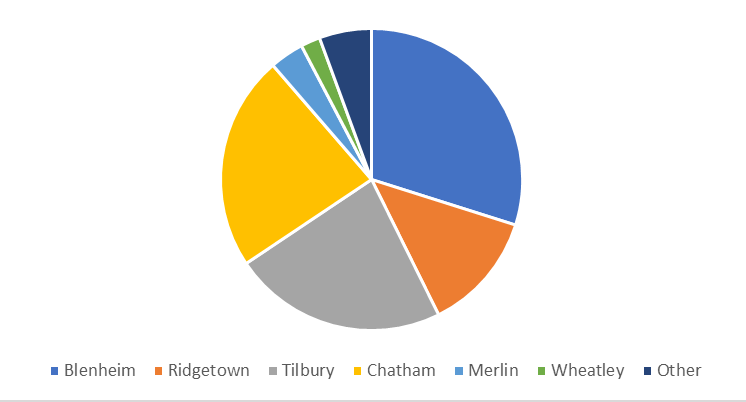
Number of Responses by School:
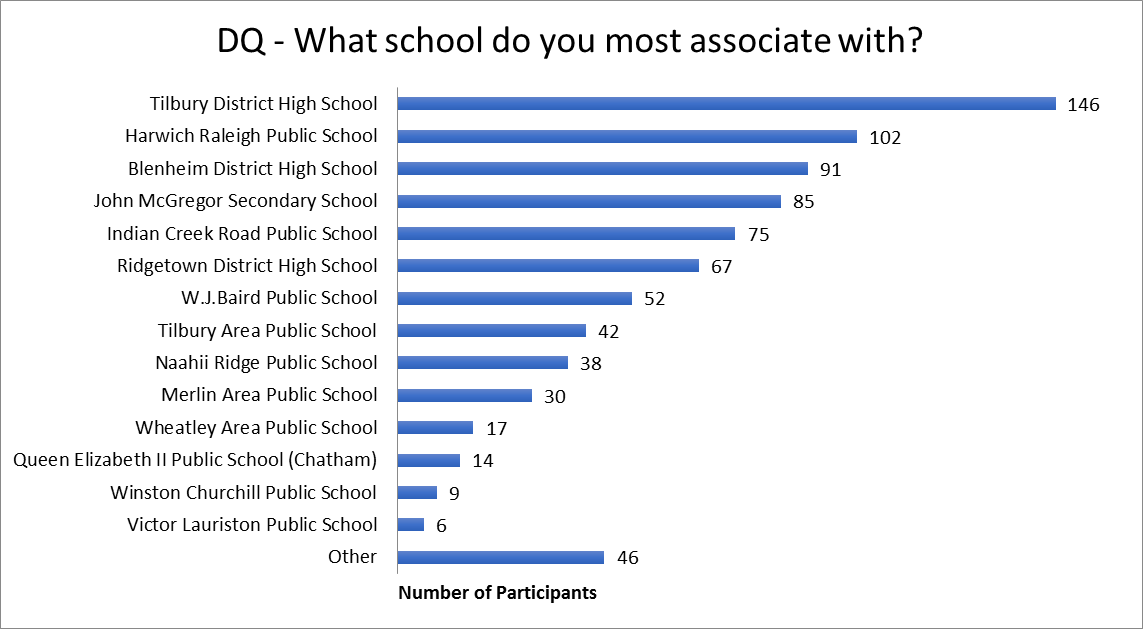
Number of Responses by Region:
| Region | Total | Percentage |
| Blenheim | 245 | 30% |
| Ridgetown | 105 | 13% |
| Tilbury | 188 | 23% |
| Chatham | 189 | 23% |
| Merlin | 30 | 4% |
| Wheatley | 17 | 2% |
Other
| 46 | 6% |